Additional Features
1. Data View
Data view’s icon is  .
.
Operation step:
Click the icon,you can see the data as figure mode,and you can refresh/close it.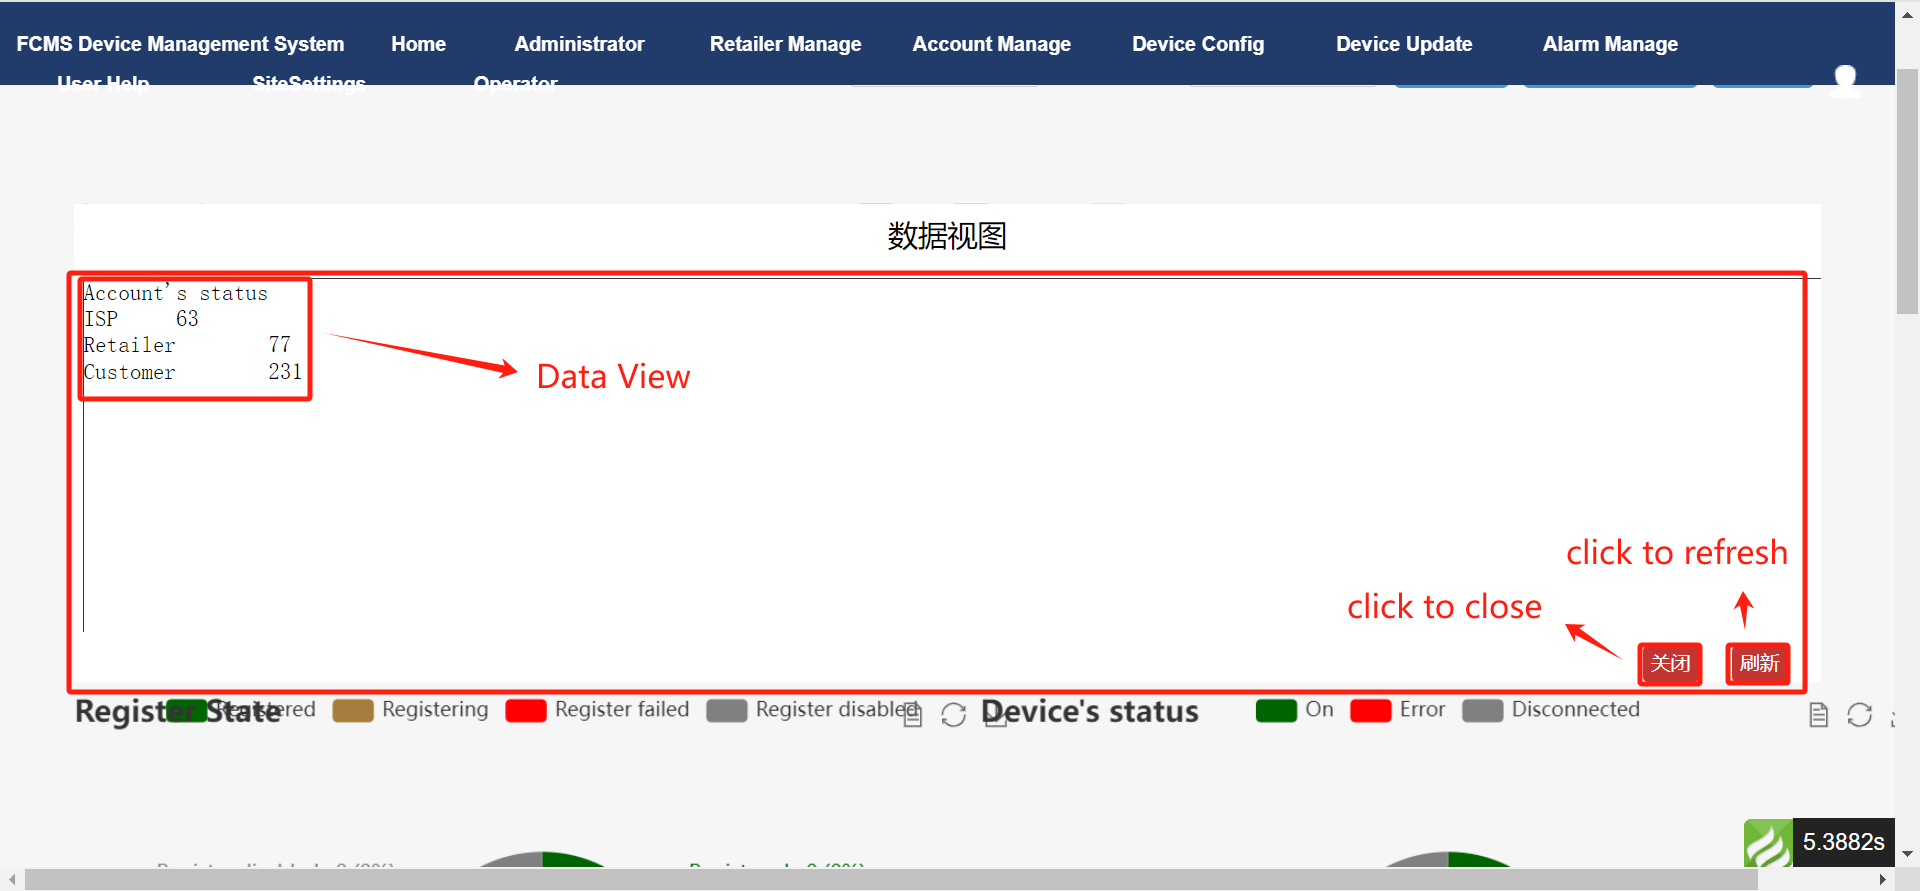
2. Restore
Restore’s icon is .
.
Operation step:
If you have change the graph shape or the data attribute,click the icon to restore the original statistical plot.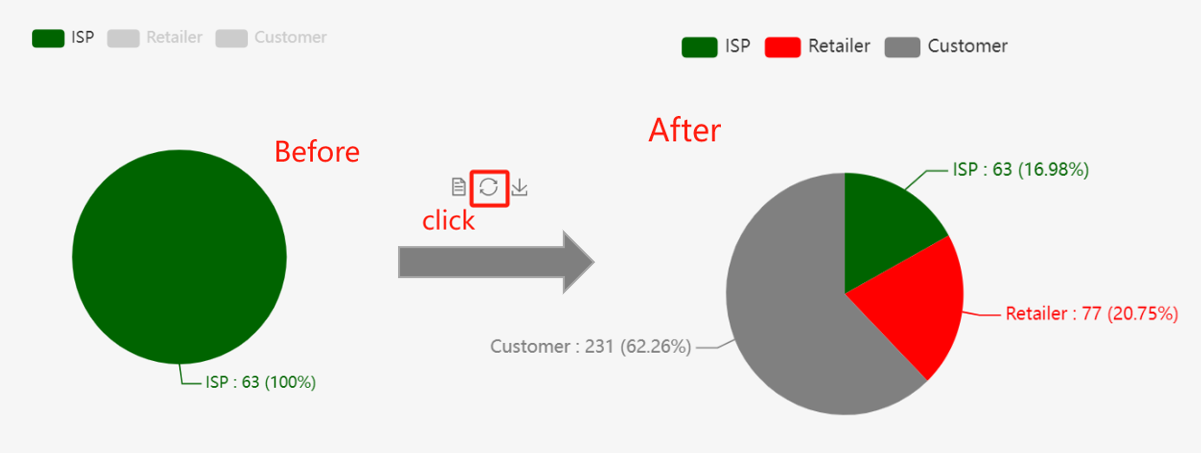
3. Switch to broken line graph
Its icon is .
.
Operation steps:
Click the icon to switch the graph to broken line graph.
4. Switch to bar graph
Its icon is  .
.
Operation steps:
Click the icon to switch the graph to bar graph.
5. Switch to Stacked
Its icon is  .
.
Operation step:
Click the icon to switch an bar graph to stacked bar graph.(Also can use in the broken line graph)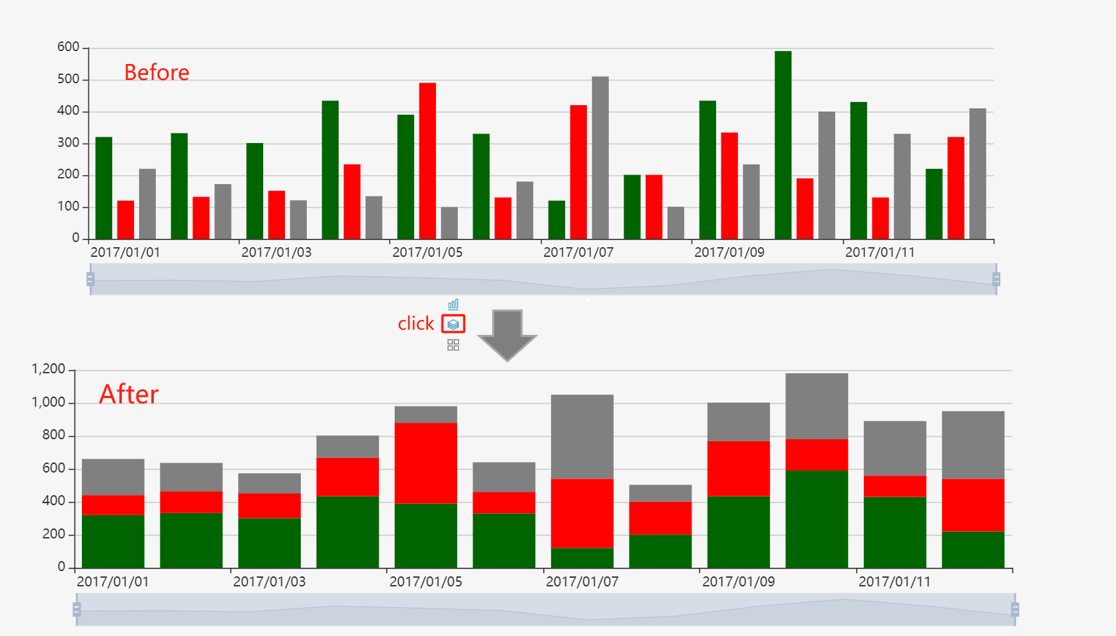
6. Switch to flat
Its icon is  .
.
Operation step:
Click the icon to switch a stacked bar graph to bar graph.(Also can use in the broken line graph)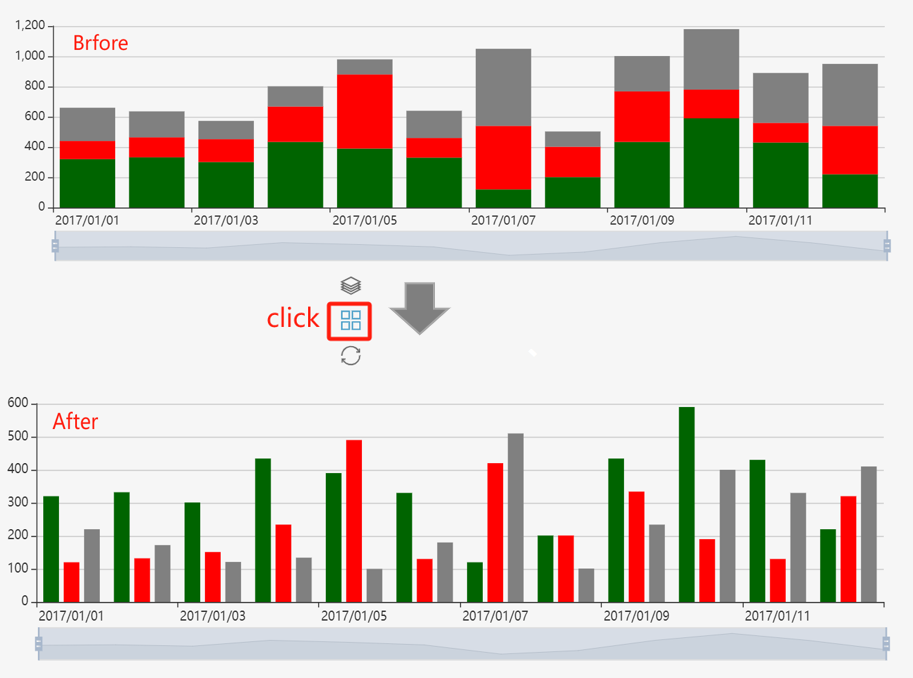
7. Axis
Its icon is: 
You can drag the axis to control what is displayed. In addition to being a axis, it’s also a zoomed out statistical plot where you can see the overall trend.
Operation step:
Drag the axis to control the displayed graph.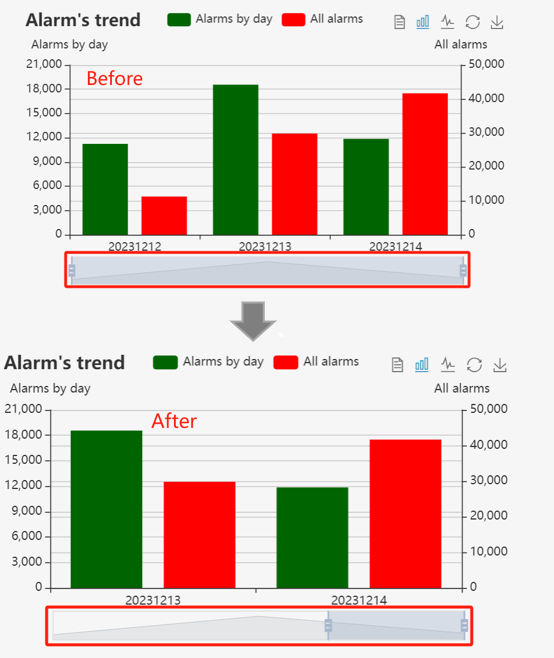
8. Save as image
Save as image’s icon is .
.
Operation steps:
Click the icon to save as an image.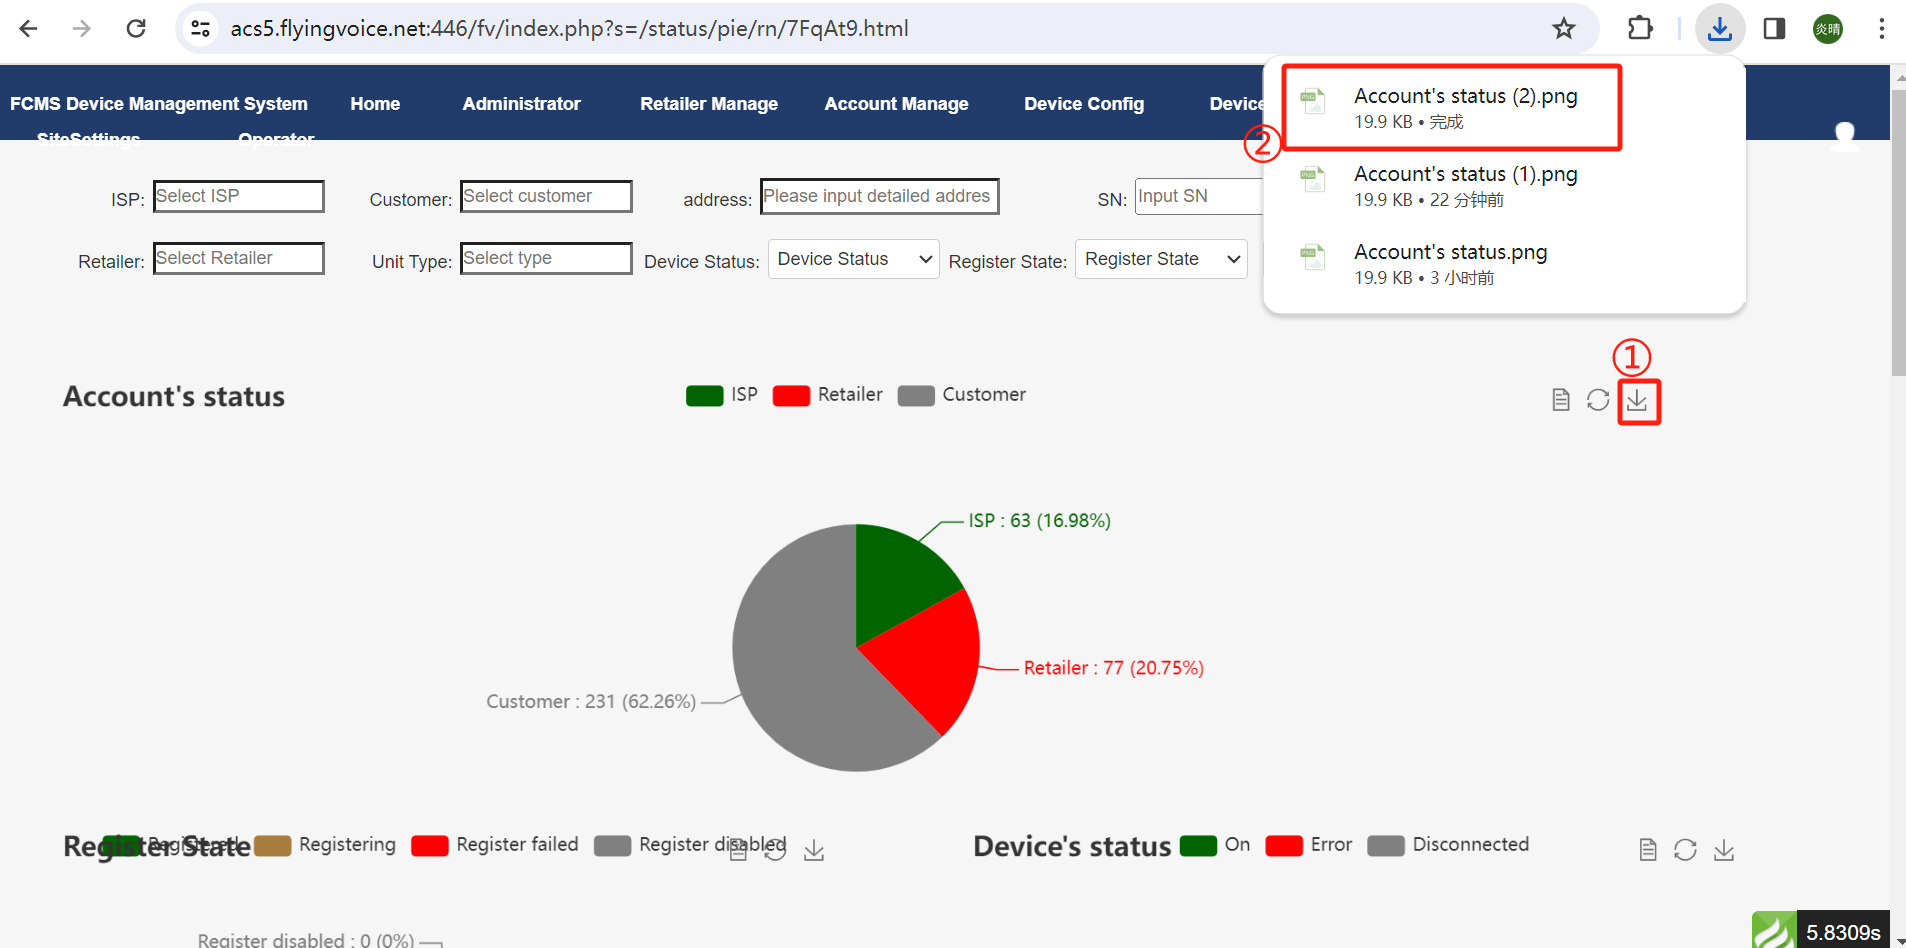
Last editor:Vertin Update time:2023-12-27 14:08
